The SPOTTED project aims to support green areas management by utilizing a blend of massive open data collections and Earth Observation data. This initiative supports decision-making processes through advanced data integration and processing techniques. SPOTTED has launched experimental services in Milan, Helsinki, and Naples, driven by the SPOTTED Platform. This platform employs open urban data alongside satellite imagery, which is processed through the GeoAI Processing Block to derive actionable insights.
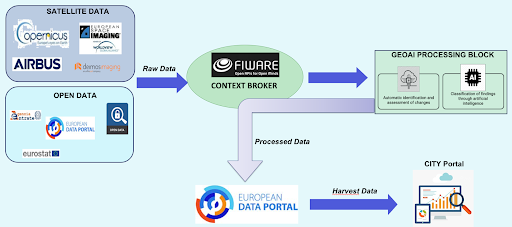
The above figure illustrates the data flow in the SPOTTED project. Central to the SPOTTED project is the FIWARE Context Broker, which orchestrates the data flow. Primary data sources include satellite data and open data repositories. The GeoAI Processing Block interfaces with the FIWARE Context Broker, efficiently managing and interpreting Digital Twin data representations. It uses the NGSI API to access both current and historical data.
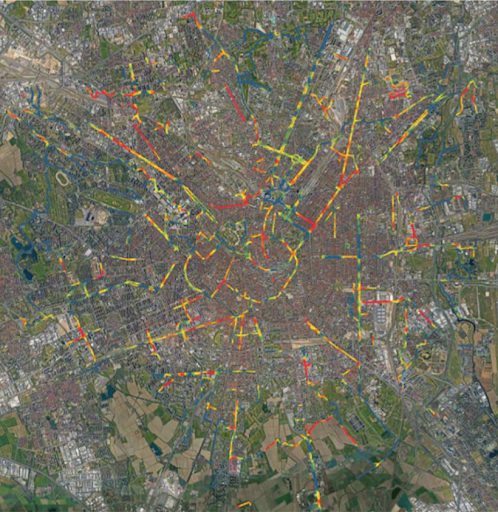
Within this context, a solution has been proposed to monitor thermal comfort specifically for soft mobility infrastructures, focusing on bicycle paths. By analyzing environmental data, specifically land surface temperature (LST), the system assesses cyclists’ comfort levels, integrating open data related to bike paths. Implementation involves a workflow executed through the Geo Processing Block, starting with data acquisition from Sentinel-2, Landsat-8, and municipal biking paths datasets via FiWare. A key step is employing a Machine Learning algorithm to enhance the resolution of LST measurements from Landsat-8 to a finer 10m resolution using Sentinel-2 data. This adjustment is crucial for accurately assessing the narrow confines of bike paths. The process then calculates temperature differences using a rural reference area to identify Urban Heat Islands. Subsequently, zonal statistics combine this data with maps of bike and pedestrian paths and open population data to pinpoint areas needing urgent intervention.
The figure below showcases the significant value added by combining open city data, such as bike paths, with Earth Observation data and geospatial data analysis.
Interested in learning more about this topic?
Dive deeper by reading the complete paper here.
Partners who supported the work: