Exploring time series, Urban Green Indexes and data integrations in the Helsinki pilot
In Helsinki, the focus has mainly been on developing new data products to measure and assess the amount of green areas in the city and to support actions related to the city of Helsinki’s goal for Carbon Neutrality. Here we showcase a few examples of demonstrations and platform testing carried out during the Spotted-project.
Since there is a growing need to reserve greenery in cities for mitigating and adapting to effects of climate change, the city of Helsinki has been showing interest to measure and quickly assess absolute and relative amount of greenery in the city. For this purpose, we have created timeseries to analyze and visualize monthly and yearly changes of NDVI and land cover in Helsinki.
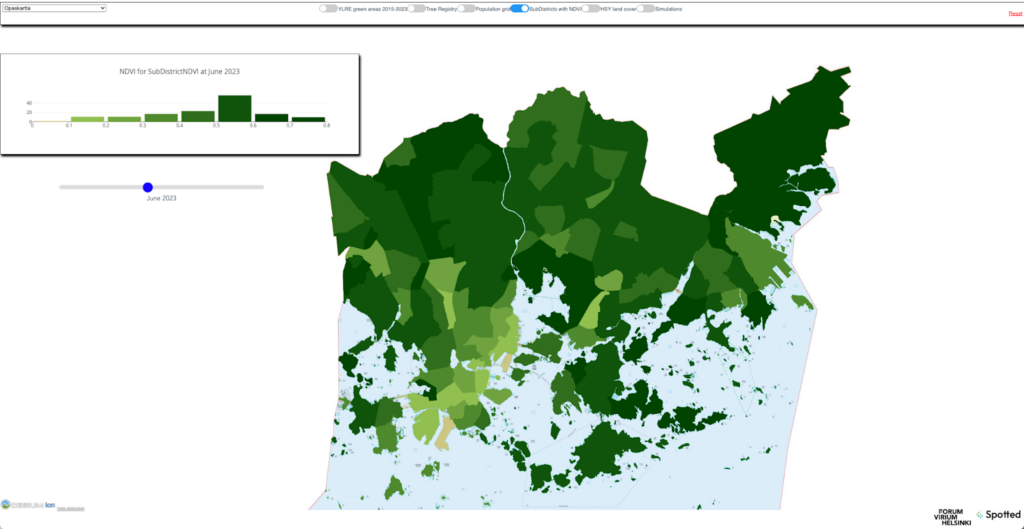
Comparing NDVI data in Helsinki subdistricts. Users can visually assess monthly changes in greenery with a simple slider.
In addition to monthly time series, we have created demos assessing yearly changes in NDVI and land cover data from Helsinki Region Environmental Services HSY.
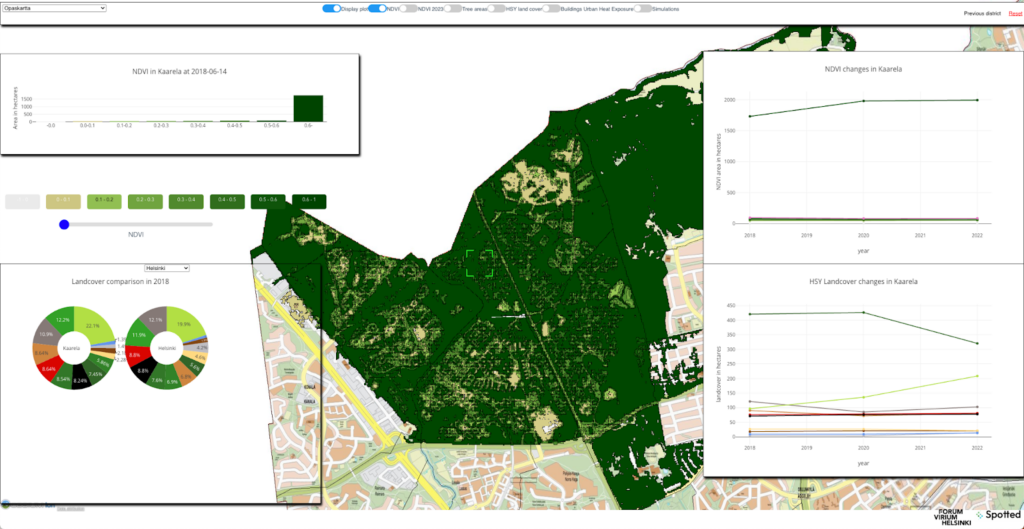
NDVI in Kaarela district in 2018 (other years can be shown by using a slider on the left) and graphs on the right present changes in both NDVI and land cover in 2018, 2020 and 2022.
Since the city of Helsinki has large quantities of open data, the work on Helsinki pilot has been focusing on creating valuable datasets based on combination of local open data and satellite analyses produced with the Spotted platform. For example, The NDVI analyses have been combined with population data to create additional value to measure the usage pressure on high NDVI green areas and accessibility of green areas to city residents. To link the project work to existing city decision making, for our demonstration we have utilized the same travel distances, namely 300m, 800m and 2000m, that the city of Helsinki uses e.g. for their assessment of accessibility of public parks.
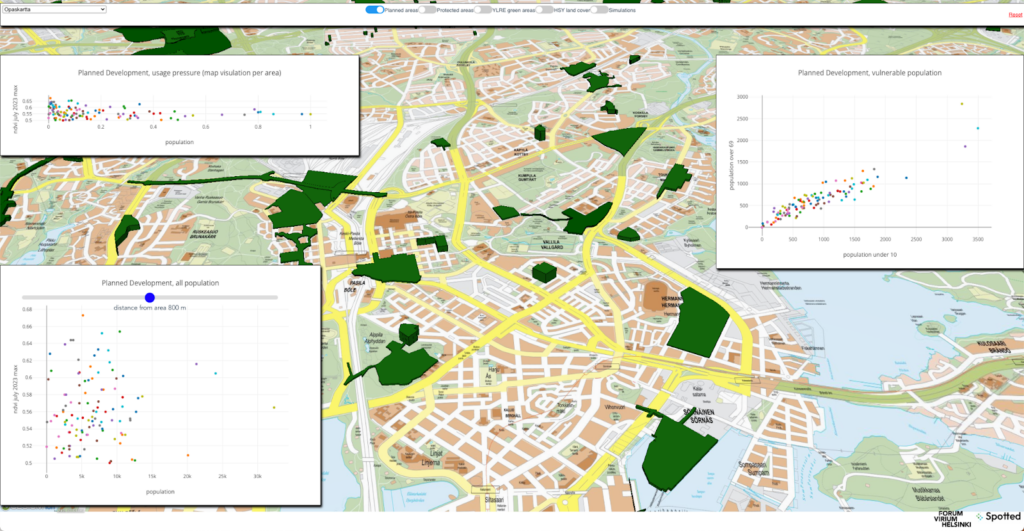
NDVI calculated for planned development areas and combined with population data to describe the existing usage pressure.
During the evaluation and platform development phase, Forum Virium Helsinki has also done testing with the heat exposure pilot service. Heat exposure has been calculated to various urban infrastructures and e.g. for all buildings in Helsinki.
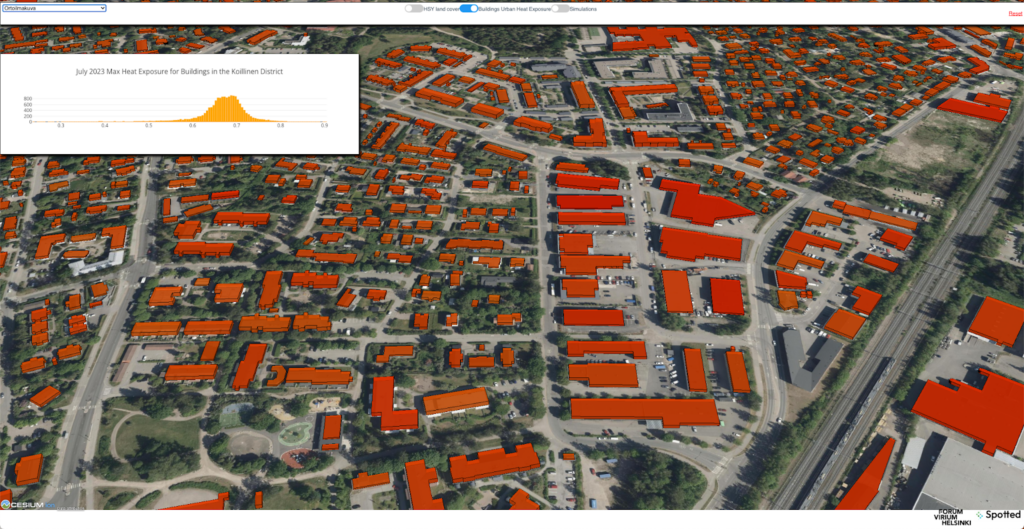
Heat exposure for buildings in the Koillinen district. The histogram on the left describes the distribution of heat exposure values. Orthoimage set as the background map via the city of Helsinki open API.
All these screenshots have been taken from an user interface which Forum Virium Helsinki has built to visualize all created and other project relevant datasets. This interactive user interface enables visual interpretation of created datasets and statistical analysis that users can utilize in comparing spatial changes. Also, the potential users, e.g. decision makers and urban planners, are able to easily integrate any additional datasets produced in the Spotted platform as the interface has functionality to upload geojson files directly to the viewer.
Feel free to explore our demonstrations and test data in the Helsinki user interface, and don’t hesitate to get in contact to hear more about the examples and conducted testing.